Like protocol analysis, you can do spectrum analysis with multiple devices. You can do mobile (laptop with an adapter) or infrastructure (with an access point). With a spectrum analysis, you are only looking to the RF, so it doesn’t matter if the network is 802.11n or 802.11ac.
In infrastructure spectrum analysis, there are two options. If you have an access point that does spectrum analysis and clients are still able to join the access point, or you have an access point where clients cannot join. In the first situation, the spectrum analysis is only on the channel where the access point is operating in. The second one, where the clients cannot join, it can do a spectrum analysis on all channels.
Another thing to think of before you do a spectrum analysis is are you using an external antenna. The choice of the antenna affects the view of the spectrum. For example, if you use an Omni antenna, you get a view all around you. When you use a directional antenna, you will see more RF in a specific direction. This is helpful when you need to know the exact location of the interference source.
There are some terminologies which need to be explained for spectrum analysis.
Duty Cycle
This is the amount of time that the amplitude is above a certain threshold. The threshold depends on the software. If the threshold is high (-90 dBm) the WLAN can still operate normally. To get a good view if the interference sources are affecting the WLAN, the threshold needs to be lower. The data that is displayed is over a sweep.
Sweep Cycles
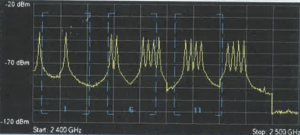
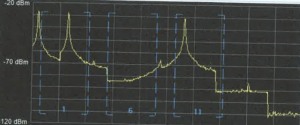
A sweep is the time that it takes to scan the whole band (2.4 GHz or 5 GHz). When you look to the real-time Fast Fourier Transform (FFT) you need to remember that this is a display from one sweep, the last sweep (it is real-time). It shows the maximum amplitude from the last sweep, the average amplitude from the last sweep, and the max sweep from all previous sweeps.
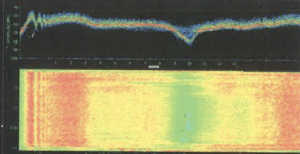
So, sweep data is only for a limited time period. There are also waterfall charts. Waterfall charts give an overview from all the sweeps. After a sweep is done, a new line will show the next sweep and so on. Every sweep is a single line and you can see the previous sweeps as well.
Resolution Bandwidth
This is the smallest frequency that can be resolved by the receiver. RBW value is measured in kHz.
Utilization
This is how much airtime is consumed by the signal. You can see this in a waterfall chart and the colors show how strong the signal is. For example, red means a strong signal and a high utilization. Blue color shows a weak signal and that means a low utilization.
Those terms are graphs or charts that can be added to the view/display in the spectrum analysis tool and it is possible to generate reports. Since you are looking at the spectrum, this can be everything, not only Wi-Fi signals. There is a feature called Wi-Fi integration. It uses the laptop adapter to scan for wireless networks and the data will be available in the spectrum analyzer software. It is now easier to find non-Wi-Fi interference sources.
When you walk around a site, you will see some patterns. If those patterns don’t tell you anything you can better stop with the walk. You need to recognize and after that locate the device. As mentioned earlier, to locate a device you need to use a directional antenna.
DSSS pattern
These patterns have a round top. The centrum channel is the amplitude high and on the left and the right the amplitude is lower.
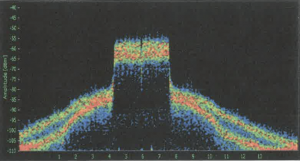
20 MHz OFDM pattern
These patterns have a flat top. In the middle, there is a gap.

40 MHz OFDM pattern
These patterns have a flat top. In the middle there is a gap, but wider than the 20 MHz variant.

Bluetooth signal pattern
Bluetooth devices can use Discovery and data transfer. Those spectrums are slightly different. By discovering pattern, you see on the lower side some transmission and in the middle, there is a band that is empty around channel 3/4.

When the device is in transfer mode you see that the transmission is over the whole band.

Cordless Phone pattern
The pattern of a cordless phone is narrowband with peak amplitude in the middle and tapered edge. There are not only cordless phones in the 2.4 GHz band, but also in 5.8 GHz.

Video Transmitter pattern
The pattern is like OFDM, but with a peak in the middle and not a gap. It is a high and narrow amplitude, with a 100% duty cycle.

Wideband Jammer pattern
Jammers are mostly malicious and have the intent to generate a high amplitude energy that disrupts all possible communication on the band. Also, check the red in the sweep cycle.

Microwave oven pattern
Microwave oven pattern looks like a cordless phone. The pattern has a high amplitude and the spectrum is wide. The center of the peak is between channel 7 and 9.

